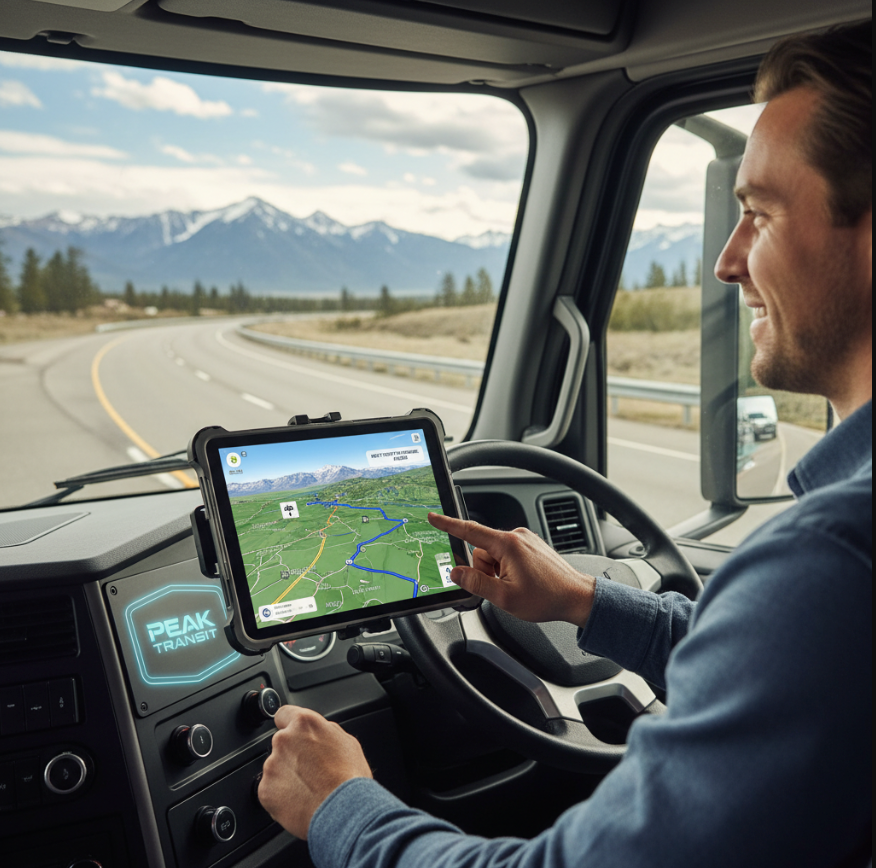
Depending on your situation, you may not need to replace your hardware at all. For many agencies, reusing existing tablets, routers, and onboard equipment is a completely viable path to a modern software upgrade — one that saves significant time and money.
Recognize when your existing hardware has become the thing standing between your agency and a truly reliable, high-performing system.
Peak Transit's RTPI goes far beyond simple location dots on a map, offering a superior experience that makes your daily commute smoother and more predictable.
Public transit agencies work hard to keep their systems running smoothly, but behind the scenes, outdated technology can silently drain budgets, frustrate riders, and slow down operations. Many agencies hesitate to upgrade their Computer-Aided Dispatch / Automatic Vehicle Location (CAD/AVL) systems, passenger information displays, or fare collection tools due to cost concerns—but the reality is that sticking with outdated technology is often far more expensive in the long run. In this post, we’ll break down the hidden costs of using aging transit technology and how agencies can modernize efficiently and affordably. The Hidden Costs of Outdated Transit Tech 1. Rising Maintenance Costs Aging hardware and software systems require frequent repairs and patches, and those costs add up quickly. Increased downtime: Old servers, onboard hardware, and network infrastructure fail more often, leading to service disruptions. Expensive vendor support: Legacy systems often require costly, specialized support contracts since only a few technicians still know how to maintain them. Incompatible components: Finding replacement parts for discontinued systems becomes a challenge, forcing agencies to rely on expensive, custom solutions. Security vulnerabilities: Older software lacks modern cybersecurity protections, putting agencies at risk of cyberattacks and data breaches. 2. Passenger Dissatisfaction & Ridership Decline A poor rider experience can drive passengers away, leading to lower fare revenue and reduced funding opportunities. Inaccurate ETAs: Outdated CAD/AVL systems struggle to provide real-time location updates, causing unreliable arrival predictions. Lack of real-time notifications: Without automated alerts for delays or detours, passengers are left frustrated and uninformed. No mobile app or outdated interface: Riders expect modern, user-friendly transit apps with trip planning and live tracking. Payment inconvenience: Older fare collection systems may lack contactless options, frustrating riders who expect tap-and-go payments. 3. Missed Revenue & Funding Opportunities Sticking with legacy systems doesn’t just cost more in upkeep—it also prevents agencies from maximizing revenue and securing funding. Limited fare collection options: Without mobile ticketing or smartcard integrations, agencies miss out on modern revenue streams. Reduced ridership data insights: Older systems don’t collect or analyze passenger data effectively, making it harder to optimize routes and justify funding requests. Grants tied to tech modernization: Many federal and state grants prioritize agencies that adopt modern transit solutions—those relying on legacy systems may miss out on crucial funding. 4. Operational Inefficiencies Outdated systems make life harder for dispatchers, drivers, and transit managers, leading to wasted time and resources. Manual dispatching headaches: Without automated vehicle tracking, dispatchers struggle to adjust routes and communicate with drivers efficiently. Inefficient fleet management: Lack of real-time monitoring means agencies can’t quickly respond to breakdowns, overcrowding, or service gaps. Paper-based processes: Many older systems still rely on printed schedules, manual reporting, and inefficient workflows that slow down daily operations. How to Fix It: A Smarter Approach to Modernizing Transit Technology Upgrading transit technology doesn’t have to be a massive, all-at-once overhaul. A phased, strategic approach allows agencies to modernize without disrupting service or breaking the budget. 1. Prioritize High-Impact Upgrades Start with the technologies that will provide the most immediate benefits. Real-time passenger information: Upgrade CAD/AVL systems to provide accurate ETAs and service alerts. Passenger apps and digital signage: Implement modern mobile tools that give riders the information they need. Contactless fare collection: Adopt mobile ticketing and smartcards to streamline payments. 2. Choose Modular, Scalable Solutions A modular approach allows agencies to upgrade in stages, rather than replacing everything at once. Flexible CAD/AVL systems: Look for solutions that integrate with existing hardware and software to minimize costs. Cloud-based platforms: Reduce reliance on outdated servers and enable remote management. APC (Automatic Passenger Counting) integration: Gain accurate ridership data to optimize service planning. 3. Leverage Grant Funding & Partnerships Many federal and state programs offer funding for transit technology improvements. FTA grants: Programs like the Urbanized Area Formula Grants (5307) and State of Good Repair (5337) help agencies modernize. Public-private partnerships: Partnering with technology providers can reduce costs and streamline deployment. Demonstration projects: Piloting new solutions in a limited area can attract grant funding and prove the value of upgrades. 4. Future-Proof with Regular Updates Avoid falling into the legacy system trap again by making regular maintenance and upgrades a core part of your transit technology strategy. Planned hardware refresh cycles: Software can often outlive hardware, but aging onboard devices (like tablets, modems, and signage) can become bottlenecks. Establish a predictable upgrade schedule to prevent unexpected failures. Standardized, modular hardware: Invest in interoperable devices that can be upgraded individually, rather than requiring full system replacements. Cloud-based software updates: Reduce reliance on on-site maintenance by choosing remotely managed CAD/AVL, passenger information, and fare systems. Proactive device monitoring: Use real-time diagnostics to detect failing hardware before it disrupts service. Lifecycle cost planning: Budgeting for gradual, planned technology upgrades prevents costly emergency replacements. By taking a long-term approach to both hardware and software , agencies can maximize their investment and avoid being locked into outdated, failing technology. The Bottom Line Outdated transit technology doesn’t just slow down operations—it creates hidden costs that drain budgets, frustrate passengers, and limit growth. By taking a strategic, phased approach to modernization, agencies can improve service reliability, reduce maintenance costs, and future-proof their operations without major disruptions. Peak Transit specializes in modular, scalable transit solutions that make modernization easy and cost-effective. Whether you need real-time CAD/AVL, automated passenger counting, or a branded passenger app, we can help you upgrade without the headaches. 📩 Let’s talk about your transit tech goals—contact us today!
Discover three key reasons why upgrading your transit systems should be a top priority this year—and how Peak Transit’s CAD/AVL solutions can transform your operations.
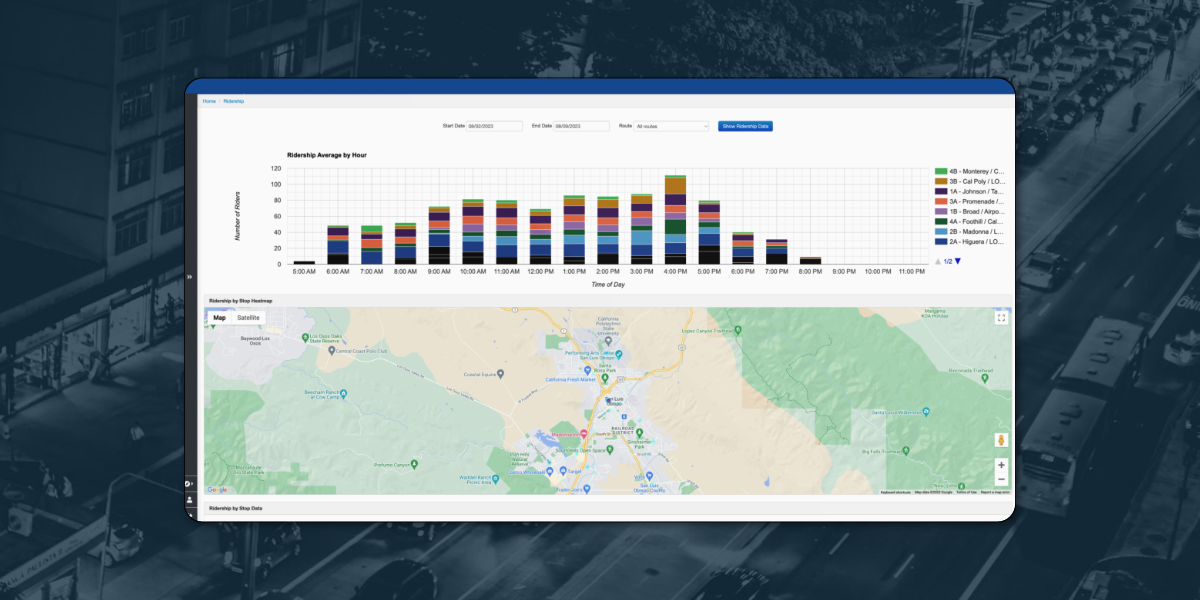
Route planning is one of the most critical aspects of transit management. With limited resources, transit agencies must ensure that their vehicles are operating efficiently, schedules are optimized for passenger demand, and services are meeting rider expectations. By leveraging technology like CAD/AVL systems and data from real-time tracking, agencies can optimize route planning to reduce costs and improve service quality. Key Strategies for Optimizing Route Planning: Data-Driven Route Adjustments: CAD/AVL systems collect data on route performance, traffic patterns, and ridership levels. This data allows agencies to identify problem areas, such as routes that consistently face delays or experience low ridership. By analyzing this data, agencies can adjust schedules or reroute vehicles to improve efficiency and reduce delays. Peak Time Management: Using real-time data, agencies can identify peak hours and adjust vehicle allocations accordingly. Routes that experience heavy traffic during rush hours can be modified with additional vehicles, while underutilized routes can be scaled back. This ensures resources are deployed where they are most needed, improving service reliability. Fleet Optimization: Technology also helps agencies monitor how well their fleet is utilized. CAD/AVL systems track vehicle usage and performance, providing insights into how long vehicles are in service, idle times, and overall efficiency. This data can be used to better allocate vehicles, reducing wear and tear, and minimizing operational costs. Conclusion: Technology is a powerful tool for optimizing route planning. By utilizing real-time data from CAD/AVL systems, transit agencies can improve service reliability, reduce costs, and better meet the needs of their riders.
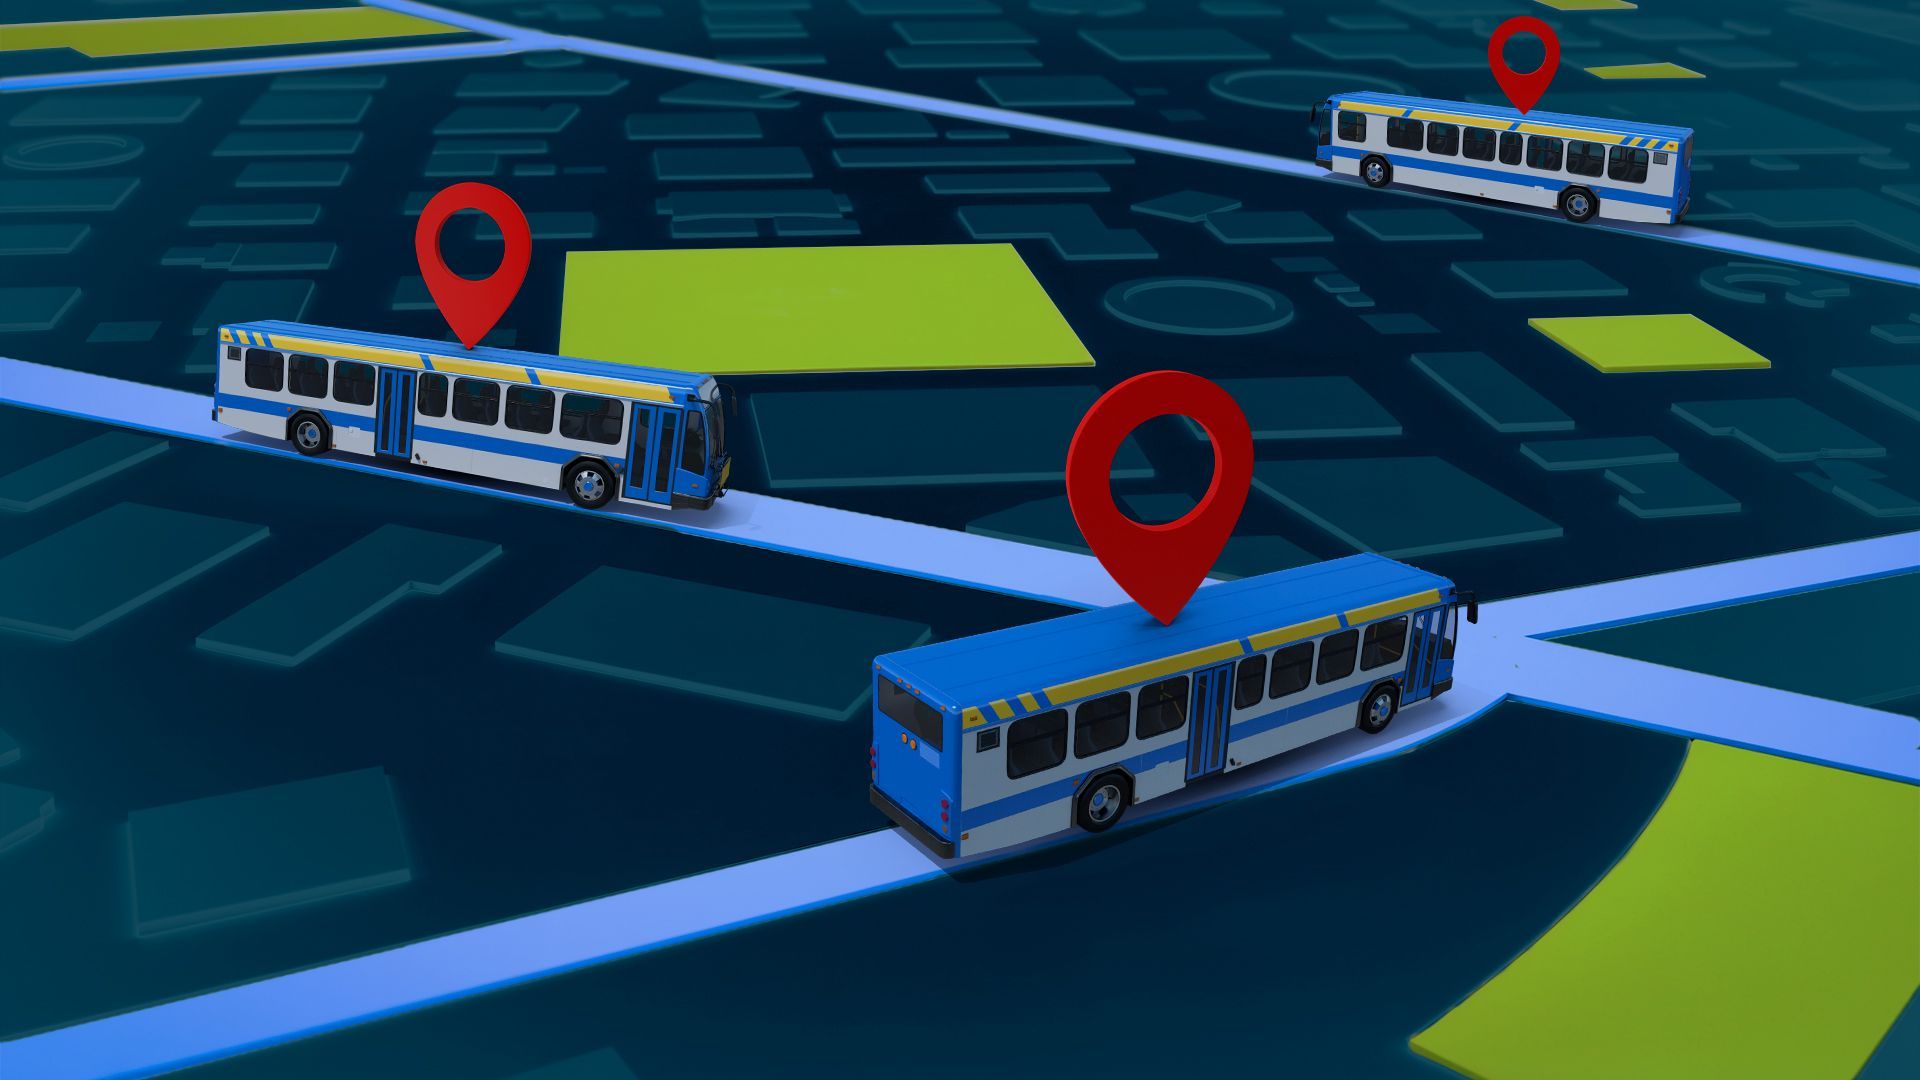
Automatic Vehicle Location (AVL) technology is a core component of transit management that allows agencies to monitor and track their fleet in real-time. This technology integrates GPS tracking with centralized software, enabling transit managers to know the exact location of their vehicles, analyze route performance, and ensure better service delivery. In an era where real-time data is critical, AVL technology helps transit agencies optimize operations, improve response times, and deliver a more reliable service to riders. But how exactly does AVL work, and what are the benefits? How AVL Works: AVL systems use GPS data to transmit the real-time location of transit vehicles to a central management system. This live data feed provides a comprehensive view of where each vehicle is on its route, how fast it’s moving, and whether it’s running on time. For transit agencies, this information is invaluable. Here’s why: Fleet Monitoring: AVL provides a bird’s-eye view of the entire fleet, showing where each vehicle is at any moment. This helps dispatchers ensure that vehicles stick to their routes and allows for rapid response to any delays or incidents. Schedule Adherence: AVL technology allows agencies to monitor whether vehicles are running on time, ahead of schedule, or falling behind. This enables real-time adjustments, improving overall service reliability. Data for Future Planning: Over time, AVL systems gather rich data on traffic patterns, route performance, and service delays. Agencies can use this data to optimize routes, adjust schedules, and plan more efficient services in the future. Why AVL Matters for Transit Agencies: Improved Fleet Management: AVL technology takes the guesswork out of managing a transit fleet. With real-time visibility into vehicle locations, agencies can make quicker decisions and improve the reliability of their services. Faster Incident Response: If a vehicle breaks down or gets stuck in traffic, AVL systems alert dispatchers immediately, allowing for fast rerouting or sending backup vehicles to minimize service disruption. Enhanced Passenger Experience: One of the biggest benefits of AVL is the ability to provide real-time information to passengers. Riders can track buses on mobile apps, know exactly when their vehicle will arrive, and plan their trips with confidence. Better Route Optimization: Using data from AVL systems, agencies can identify problem areas in their service, whether it’s a route that consistently faces delays or a stretch of road that always causes slowdowns. Over time, this allows for more effective route planning and improved operational efficiency. Conclusion: AVL technology is a game-changer for transit agencies that want to improve fleet management, reduce delays, and deliver better service to passengers. By investing in AVL, agencies gain real-time control over their operations, ensuring they can respond quickly to challenges and keep their services running smoothly. Ready to experience the benefits of AVL? Learn how Peak Transit’s AVL solutions can transform your transit operations. Schedule a demo today.
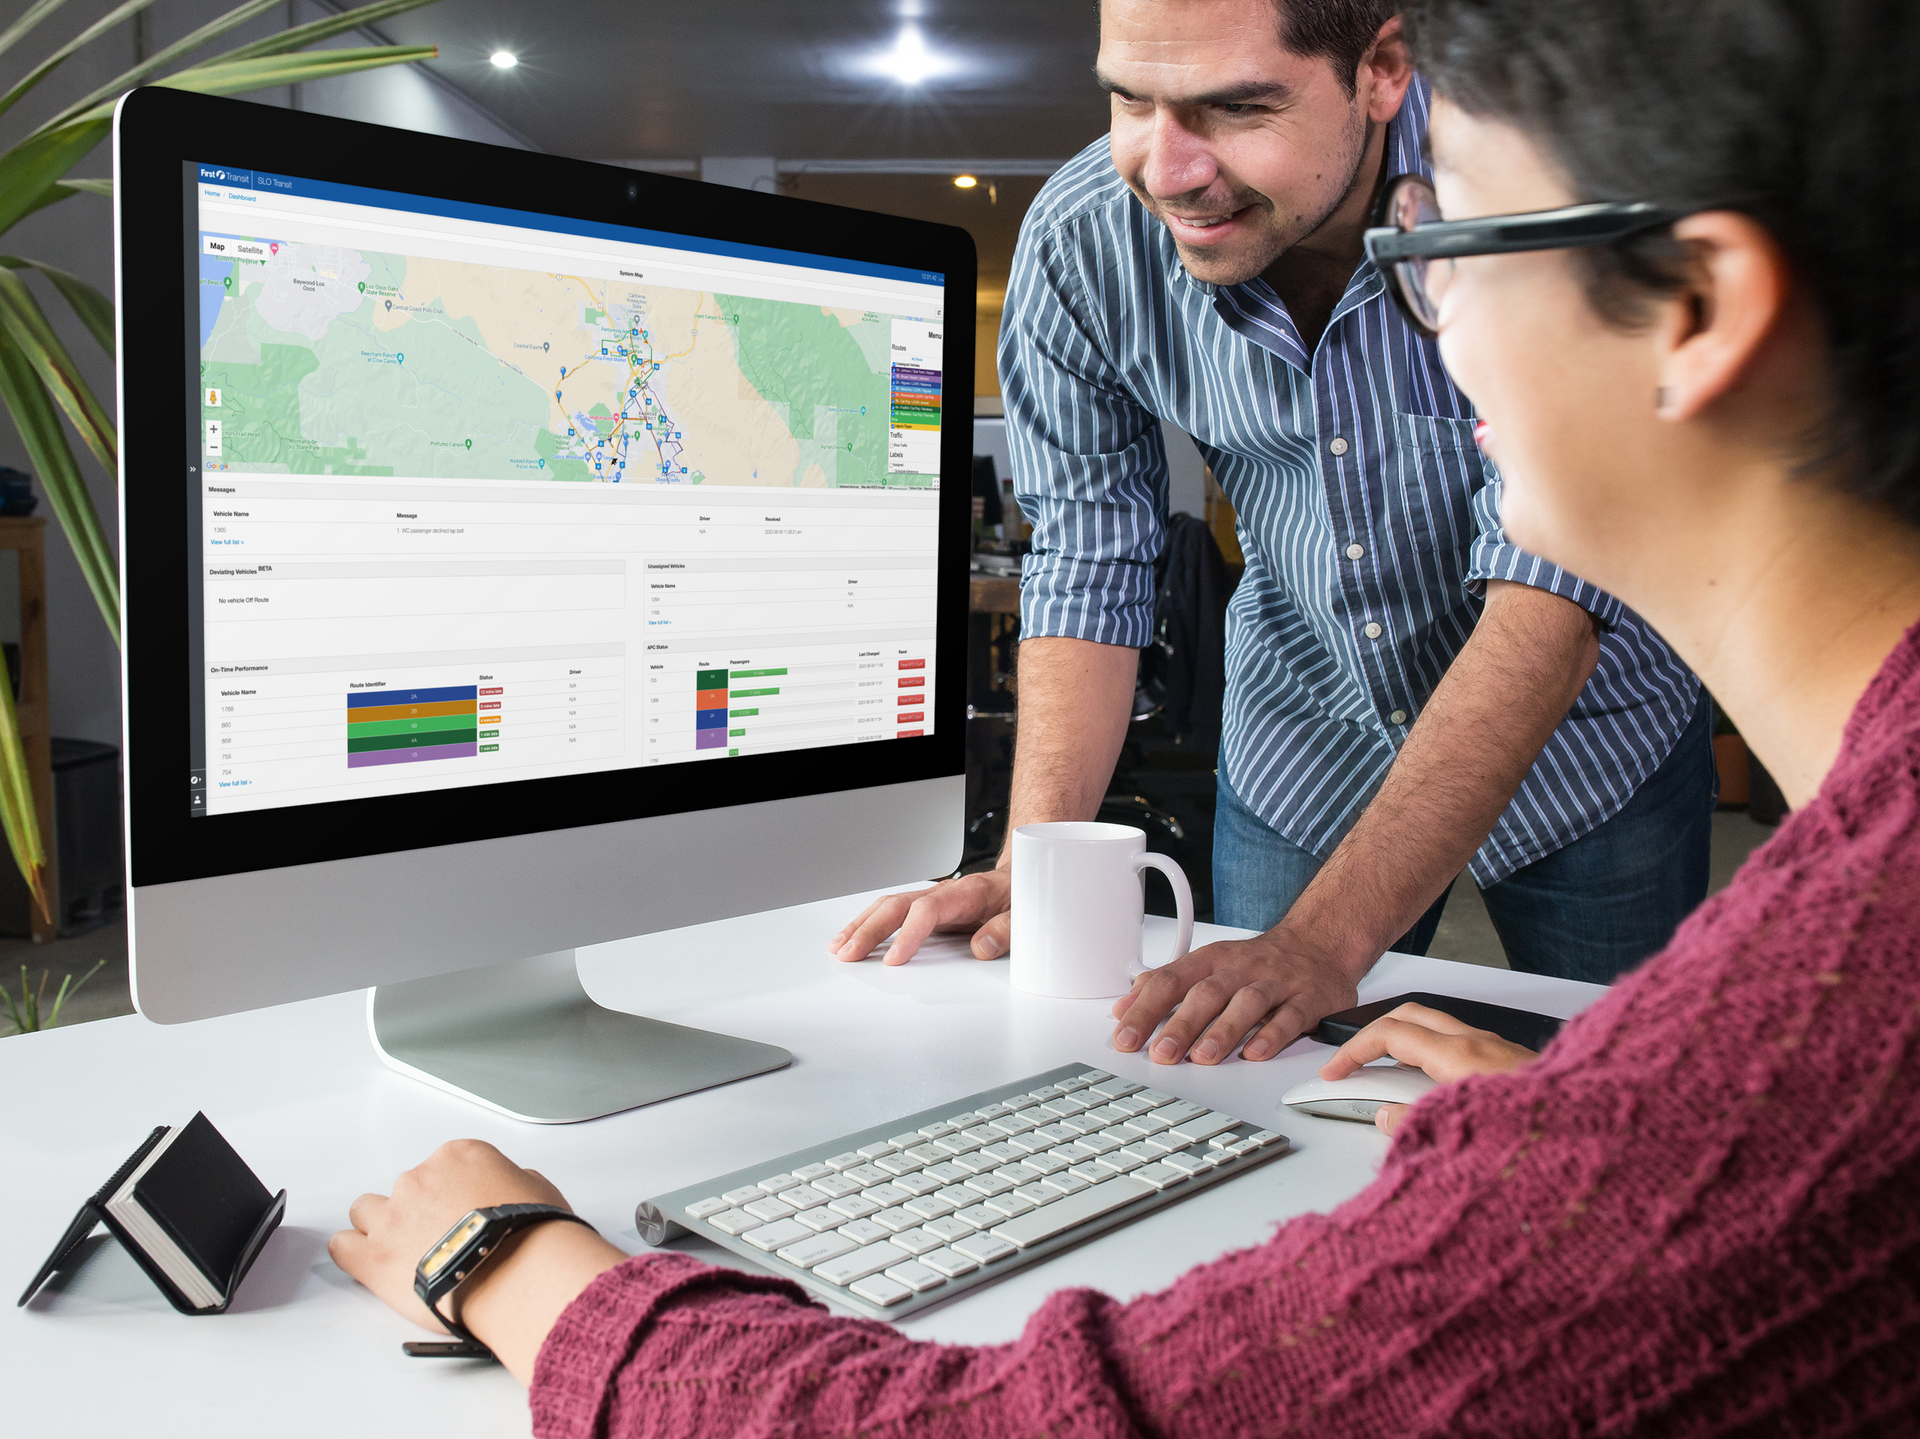
Computer-Aided Dispatch/Automatic Vehicle Location (CAD/AVL) technology has become a cornerstone of effective transit operations. As transit systems grow increasingly complex, managing fleets, ensuring on-time performance, and meeting rider expectations require real-time oversight. CAD/AVL integrates GPS tracking with software tools for dispatch and route management, allowing agencies to track vehicles in real-time and optimize operations. How CAD/AVL Works: At its core, CAD/AVL systems connect a vehicle’s GPS data to a central dispatch platform, providing real-time vehicle location, driver performance metrics, and route adherence details. This integration enables transit agencies to: Track vehicles in real-time: Dispatchers know exactly where each bus or train is at any given moment. Monitor driver behavior: Analyze driving patterns, speeding events, or deviations from the planned route. Improve response to incidents: If a vehicle breaks down or an emergency occurs, dispatchers can reroute vehicles quickly, notify drivers, and communicate delays to passengers. Key Benefits for Transit Agencies: Optimized Route Performance: CAD/AVL helps agencies ensure that vehicles stay on schedule by providing real-time insights. Dispatchers can respond quickly to delays, adjust routes dynamically, and ensure that buses run on time, even in unpredictable traffic or weather conditions. Better Dispatching Decisions: When vehicles stray off their planned route or face obstacles like accidents or road closures, CAD/AVL provides real-time data, allowing for immediate corrective actions. This level of situational awareness improves fleet management and ensures service reliability. Data-Driven Decision Making: Over time, CAD/AVL systems collect valuable data on traffic patterns, driver performance, and rider behavior. Agencies can use this data to adjust schedules, optimize routes, and make informed decisions about future service needs. Enhanced Rider Experience: With real-time tracking, passengers receive accurate information on bus arrival times via mobile apps or digital signage, reducing uncertainty and improving customer satisfaction. For transit agencies, offering this level of transparency helps build rider trust and loyalty. Implementing CAD/AVL for Long-Term Success: Whether you’re operating a small fleet or managing a large metropolitan transit system, CAD/AVL technology is scalable and customizable to meet your agency’s needs. By integrating CAD/AVL with your existing systems, you can enhance the efficiency of your operations, reduce costs, and improve service reliability. Conclusion: CAD/AVL systems are not just tools for monitoring your fleet—they are a strategic investment that drives efficiency, improves service quality, and provides long-term benefits for both transit agencies and passengers. As transit demands grow, adopting CAD/AVL technology will ensure your agency remains responsive, adaptable, and competitive. Discover how Peak Transit’s CAD/AVL solutions can help your transit agency run more efficiently. Schedule a demo!

The holiday season brings unique challenges and opportunities for transit agencies. With increased ridership to bustling shopping districts, festive events, and holiday gatherings, combined with fluctuating commuter traffic, it’s essential to adapt your services for maximum efficiency. To help you prepare, we’ve compiled key strategies to ensure your transit agency is ready to navigate the busy holiday period with ease. 1. Boosting Capacity for High-Demand Areas During the holidays, certain routes—especially those serving shopping districts, holiday markets, and events—see a surge in demand. To ensure a smooth travel experience for passengers: Increase schedule frequency on popular routes to accommodate the influx of travelers. Consider extending service hours in the evenings when people attend late-night shopping events or holiday parties. Deploy additional resources strategically. Adding extra buses or trains during peak times can help prevent overcrowding and improve service reliability. Aligning your service with major holiday events by collaborating with local organizers ensures you can meet spikes in demand. Consider express services for holiday destinations, offering passengers faster routes to popular shopping centers or festive hubs, reducing the stress of long, multi-stop journeys. By preparing in advance and enhancing your service where it’s needed most, you’ll help keep passengers moving smoothly during this high-demand season. 2. Optimizing Communication & Real-Time Updates Clear and timely communication is key to providing a positive experience during the holiday rush. With passengers likely facing longer wait times and potential service changes, ensuring they have access to accurate, up-to-date information can make all the difference. Enhance real-time communication through your branded passenger app, digital signage, and social media platforms. Service alerts for delays, detours, or any changes in routes due to holiday traffic should be communicated instantly. Utilize mobile apps to push notifications directly to passengers’ phones. By offering real-time tracking of buses or trains, you can help riders plan their journeys more efficiently, minimizing frustration caused by unpredictable service. Promote contactless payment options to reduce delays at boarding points. Encouraging passengers to use contactless systems not only speeds up boarding but also enhances the overall efficiency of your services during the busiest times. 3. Managing Resources in Low-Demand Areas While urban centers may experience a surge in demand, commuter-heavy regions could see a decline during the holidays, as businesses close or operate at reduced capacity. This is an opportunity to optimize your resources: Reduce service frequency on routes where ridership historically drops during the holiday season, allowing you to redirect those resources to busier areas. Consider demand-responsive transit (DRT) options in suburban or rural areas where fixed-route services may not be as necessary. DRT can offer flexible, on-demand transit services, helping to maintain efficient operations without over-deploying resources. Reevaluate and adjust routes to bypass areas with reduced ridership, prioritizing regions with consistent demand. Clearly communicating these temporary changes across social media and your passenger app will help manage expectations and avoid confusion. By monitoring and adjusting your service offerings dynamically, you’ll maintain efficiency without sacrificing passenger satisfaction. 4. Leveraging Data for Smarter Holiday Planning Data is your most powerful tool when planning for the holidays. Historical data on ridership trends, combined with real-time analytics, will allow you to make informed decisions about where and when to deploy resources. Analyze past holiday ridership data to anticipate this year’s demand. Identify which routes experienced the highest passenger volumes and which saw decreases, then adjust schedules and resource allocation accordingly. Use predictive analytics to foresee upcoming challenges. Predictive models can help forecast surges in ridership based on factors like weather patterns, special events, and time of day, allowing you to prepare in advance. Set KPIs (key performance indicators) to track success during the holiday season. Metrics like on-time performance, vehicle utilization, and passenger satisfaction should be monitored closely, allowing you to make adjustments in real-time if needed. By adopting a data-driven approach to your holiday planning, you’ll not only enhance service reliability but also make more cost-effective decisions for your agency. 5. Encouraging Off-Peak Travel With increased ridership during peak times, one of the most effective ways to balance the load is by promoting off-peak travel. Encouraging passengers to avoid the busiest times helps distribute demand more evenly throughout the day. Offer fare incentives during less crowded hours. Discounts for traveling outside of peak times can be a powerful motivator for passengers who have the flexibility to shift their travel schedules. Promote quieter times for travel through social media and apps, helping passengers plan their journeys around the busiest periods. Highlight alternative routes or quieter stations to guide riders toward less congested options. Collaborate with local businesses to offer combined promotions that reward customers for traveling during off-peak times. For example, retailers might offer discounts to shoppers who arrive during less busy hours, helping reduce crowding on public transit. By encouraging passengers to travel when services are less strained, you’ll improve the overall efficiency of your transit network and reduce stress for both your operations team and riders. 6. Post-Holiday Reflection & Long-Term Strategy Once the holiday season winds down, it’s time to assess what worked and where improvements can be made. A post-holiday review will help inform future planning and enhance your year-round transit services. Analyze service performance using ridership data, on-time performance metrics, and passenger feedback. Identify any routes that experienced consistent overcrowding or any communication gaps that need to be addressed. Use insights to plan ahead for next year. By building on the data gathered during this holiday season, you can refine your strategies and improve your service delivery for future peak periods. Engage with your community through surveys and feedback loops. Gathering input from passengers will help you identify areas where your service exceeded expectations and where there’s room for improvement. Long-term, these insights can guide operational improvements and shape your transit agency’s overall strategy for dealing with high-demand periods in the future. Take Action Today The holiday season is one of the most challenging times for transit agencies, but with the right strategies in place, you can ensure smooth operations, satisfied passengers, and efficient use of resources. Ready to elevate your transit services for the holidays—and beyond? Schedule a demo today to learn how Peak Transit’s advanced, data-driven solutions can transform your operations and keep your passengers moving all season long.
This guide will walk you through the essential factors to consider when selecting fixed route software for your agency.